Early Television  
Mechanical TV History How it Works Mechanical Sets at the Museum Gallery Database Summary Broadcasting Technical Inforation Restoration Advertising Articles Roger DuPouy's Site Peter Yanczer's Site Gerolf Poetschke's Site Eckhard Etzold's Site
Early Electronic Television History American Sets at the Museum British Sets at the Museum Gallery Database Summary Broadcasting CRTs Accessories Technical Information Restoration Advertising Articles Gerolf Poetschke's Site Eckhard Etzold's Site
Postwar American TV History American Sets at the Museum British/Europen TV History British/Europen Sets at the Museum TV in the Rest of the World Gallery of Unusual Sets Broadcasting CRTs Accessories Technical Information Restoration Advertising Articles Eckhard Etzold's Site
Early Color TV History Sets at the Museum Gallery Database Summary Broadcasting CRTs Accessories Technical InformationRestoration Advertising Articles Pete Deksnis's Site Ed Reitan's Color Television History Eckhard Etzold's Site
The Early Television Foundation About the Museum Directions to the Museum Articles about the Museum Support the Museum Join our Email List Our Newsletter - "What's New in Old TVs" Equipment Donations Museum Members and Supporters Members Only Monthly Online Meetings Annual Convention Swapmeets
What's New on the Site Classifieds Parts for Sale Resources North American Radio and TV Museums Search the Site
Contact Us FacebookYouTube Channel
 

Early Television

Home Page

The Set: Pete Deksnis's Site about the CT-100

Restoring a Vintage Color Television Set

Early Television

Here's the standard "spectrum locus" horseshoe curve representing all colors our eyes can see. Values on the curve (seen in detail below) are in millimicrons (10^-9 cm) and represent saturated colors. Of course, there's no way this color graphic can anything but suggest the colors we can see.

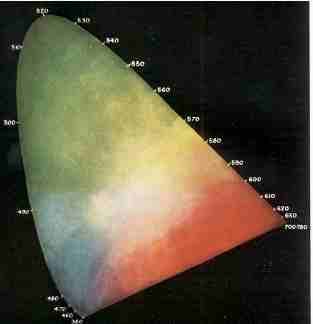
The point of this page is to intimate how color reproduction systems are limited, especially color printing and color television. The color spectrum graphic was scanned from a 1955 text on color television, so it begins with about the same hue and saturation limitations as the monitor you're watching.

The rest is speculation...
  • ...a shaded area in the center represents the color capability of the four-color printing process.
  • ...musing about phosphor standards. See [1], [2], and [3] below:
Early Television
Red, green, and blue coordinates were embellished to better illustrate
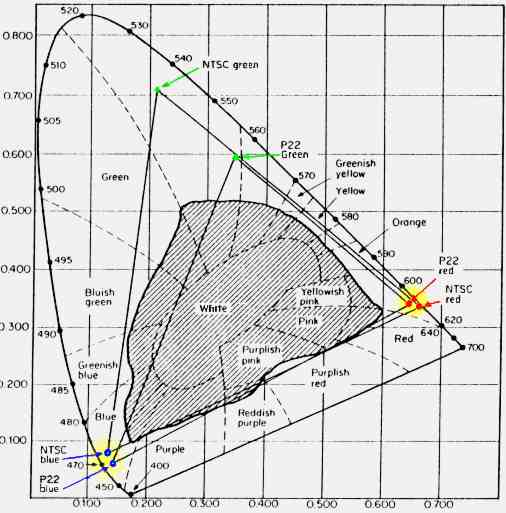
the disparity between NTSC and P22 triangles in the green area.

[1] The 1953 FCC adoption of NTSC COLOR TELEVISION STANDARDS defined the intensity and hue of red, green, and blue in terms of x-y coordinates on the color chart. They are labeled NTSC red, NTSC blue, and NTSC green on the chart:

FCC 1953 Receiver Phosphors:
Red 0.674(x) 0.326(y)
Green 0.218(x) 0.712(y)
Blue 0.140(x) 0.080(y)

[2] Manufacturers of MONITORS for the BROADCAST INDUSTRY were not governed by an industry standard (although a broadcast monitor with a 15GP22 tricolor picture tube could probably effectivly meet the 1953 FCC standard for red, green, and blue). It was not until 1979, however, that a broadcast monitor manufacturer had an industry standard -- the Society of Motion Picture and Television Engineers' SMPTE "C" standard for intensity and hue of red, green, and blue phosphors. They are labeled P22 red, P22 blue, and P22 green on the chart:

SMPTE "C" broadcast monitor phosphors:
Red 0.630 0.340
Green 0.310 0.595
Blue 0.155 0.070

There is a clear and significant difference between the coordinates for NTSC green and SMPTE-C P22 green.

[3] Now here's the odd thing: The TELEVISION MANUFACTURERS have no standard for x-y coordinates on the color chart.

The EIA (Electronics Industry Association), an organization of manufacturers of electronic-based consumer products, recognizes the SMPTE "C" phosphors, but did not use them, or any other standard including NTSC, to define colors of phosphors. Manufacturers are free to select their own intensity and hue for red, green, and blue in terms of x-y coordinates on the color chart.

Here's an intersting update from Dave Corbett highlighting the colorimetery saga from an industry perspective. Click here. Update: 02 May 2002.

[Return]


Early Television Museum
5396 Franklin St., Hilliard, OH 43026
(614) 771-0510
info@earlytelevision.org